Published August 30, 2021
July Market Report San Antonio

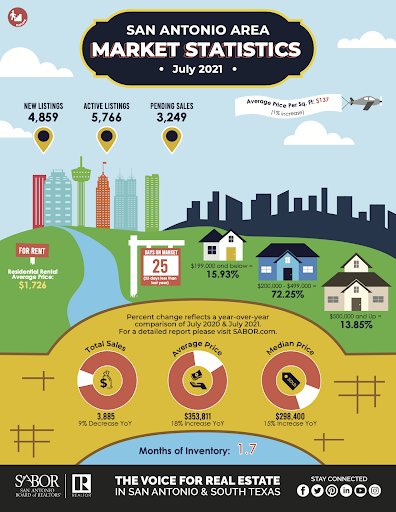
Home sales in July 2021 decreased slightly when compared to July 2020, from 4,285 to 3,885. However, the San Antonio market is continuing to show movement in home purchases and sales. There were 3,249 pending sales leading into August, with 4,859 new listings in July. All data was provided by the San Antonio Board of REALTORS® (SABOR) which reports on all areas contained within the MLS.
"Looking across other metropolitan counties, Bexar, Harris, Travis, and Dallas all showed a decrease in sales this month. However, homes are being purchased more quickly, with the average number of days on the market in San Antonio at 25 days, and Bexar County at 23 days," said Cher Miculka, Chairman of the Board. "This is more than half the time it took for homes to sell last year."
Home sale prices in July averaged $353,811 with a median price of $298,400. Comparatively, the average price in Texas was $392,429, which is 18.5 percent higher than last year. The median price in Texas increased 16.7 percent up to $315,000, compared to $270,000 last year.
Bexar County specifically reported 3,490 new listings, up from 3,108 in 2020. In all of Texas, a total of 48,582 new listings hit the market in July, a 5.7 percent increase year-over-year.
SABOR Multiple Listing Service Report: July Home Sales Recap
*Percentage increases are based on a year-over-year comparison.
Bexar County total home sales reached 2,788, a small decrease from the 3,066 homes sold last July. Comparatively, Travis County's home sales decreased 14.3 percent (1,590 homes), Harris County decreased 3.8 percent (5,234 homes), and Dallas County decreased 17.5 percent (2,048 homes) year-over-year.
We are learning that home inventory, which we are all aware has been quite low over the past year, is climbing! This is great for anyone looking to buy as you will now have more options to choose from. On the downside, homes are continuing to get more expensive. Luckily, San Antonio remains below the statewide average when it comes to the average price to buy a home. If you’re in the area, it might be a good idea to jump on it before prices have the potential to increase even more.
Find homes in San Antonio here
Home is where the heart is. Let us help you on your search for peace and comfort in your own home.
Search for Homes
Get Your Free Ultimate Guide to Living in San Antonio
|


or another way